How to Enroll
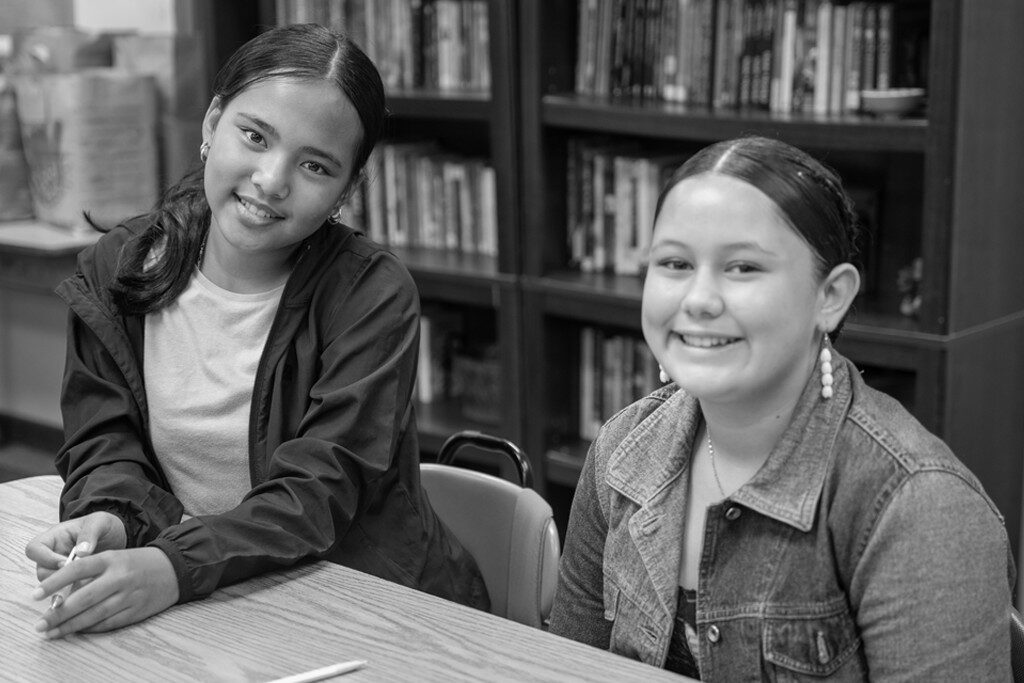
Enrolling in Hawaiʻi’s public schools is a straightforward process that involves determining school eligibility, preparing required documents, and completing an application either online or in person.
Find Your School
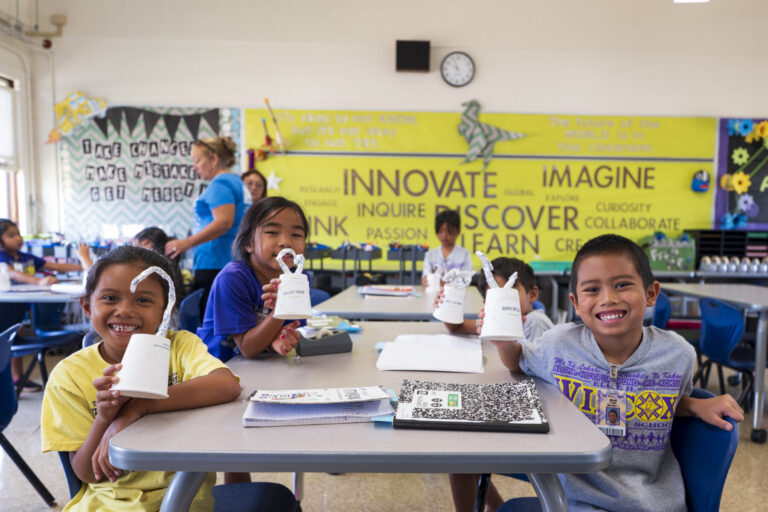
The Department is committed to providing a high-quality education for all students and we look forward to welcoming your child to our school system. Use the School Finder to find the schools that serve your area.
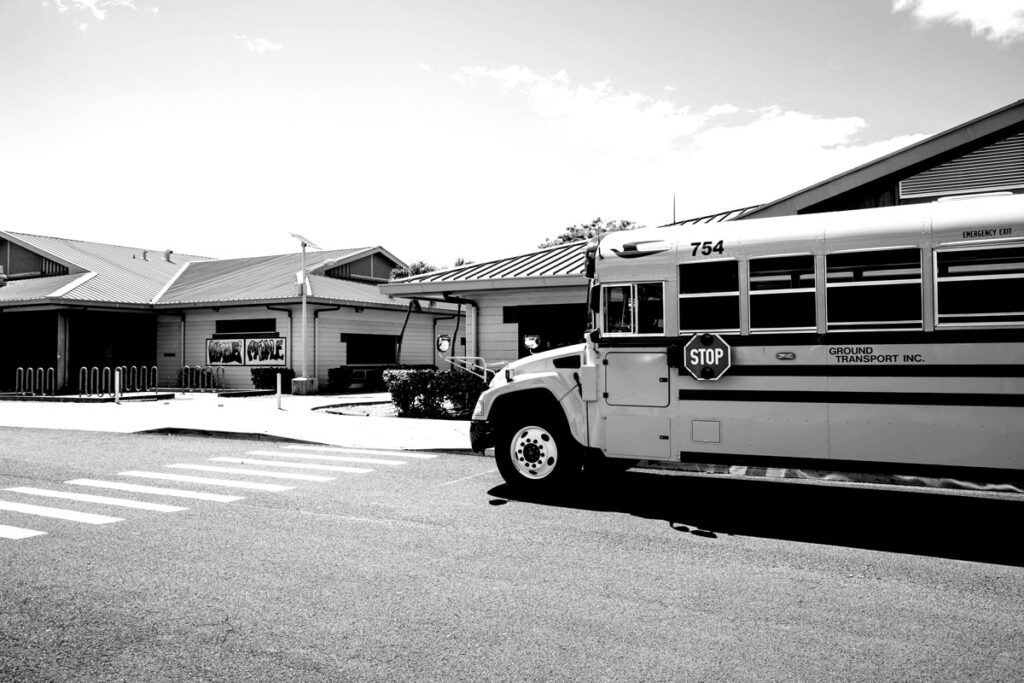
Ride the Bus
The Department provides bus service in neighborhoods around the islands to ensure broad access to educational opportunities for Hawaiʻi’s students and serves about 25,000 student riders across the state.
News & Events
What’s Happening
-
 Back-to-school success: Attendance, cell phone, bus and meal reminders for students and familiesThe Hawaiʻi State Department of Education has helpful reminders for families to ensure success and tips to support students’ learning journey.
-
08/03/2026Students' First Day
-
08/21/2026HOLIDAY: Statehood Day
Schools and state offices are closed.
-
09/07/2026HOLIDAY: Labor Day
Schools and state offices are closed.
-
10/02/2026End of Quarter 1
-
10/05/2026 10/09/2026Fall Break
-
11/03/2026HOLIDAY: General Election Day
Schools and state offices are closed.
-
11/11/2026HOLIDAY: Veteran's Day
Schools and state offices are closed.
-
11/26/2026HOLIDAY: Thanksgiving
Schools and state offices are closed.
-
11/27/2026School Holiday
-
12/18/2026End of Quarter 2, Semester 1
-
12/21/2026 12/24/2026Winter Break
-
12/25/2026HOLIDAY: Christmas
Schools and state offices are closed.
-
12/28/2026 12/31/2026Winter Break
Attend Today
Achieve Tomorrow
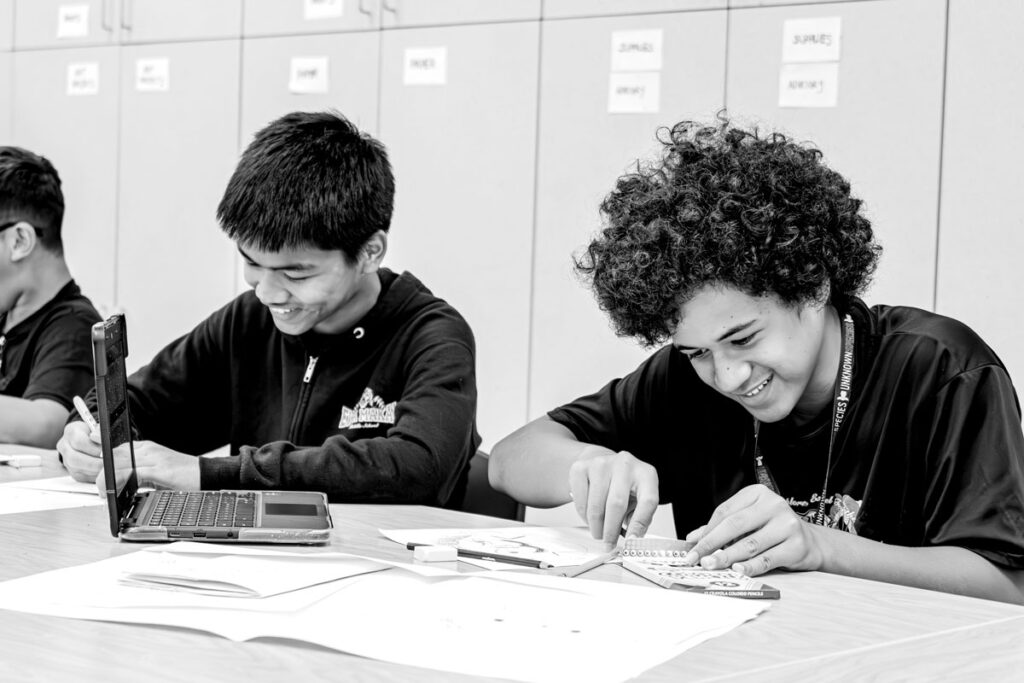
Students who consistently attend school are more likely to achieve academic excellence, develop strong social skills, and cultivate a lifelong love of learning. By being present in the classroom, students gain access to a world of knowledge and develop the confidence to reach their full potential.
Job Opportunities
Make a Real Difference
Year-round, we hire dedicated teachers, educational specialists and staff to foster equity and excellence in our public schools. We seek talented, skilled and passionate professionals who will help bring the Department’s Strategic Plan to life.
SIGN UP FOR THE HOʻOHAʻAHEO NEWSLETTER
Stay informed on the latest news, stories and events from Hawai‘i public schools!